Difficulty: Rating: GCSE Marks:  |
GCSE Text:
Simon is travelling on an 8pm Ferry crossing from Calais (France) to Dover (UK). Ferry crossings cost different amounts depending on the time of day that you cross. In this graph, the costs are shown for a typical August day:
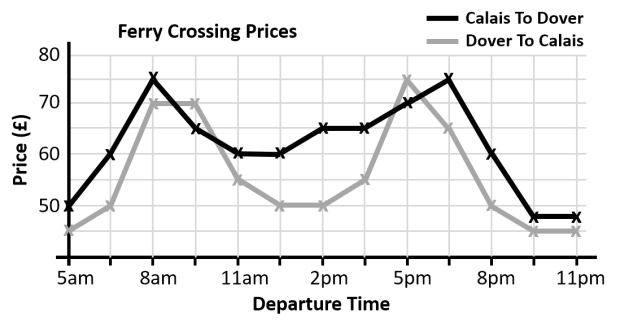
a) How many crossings each day from Calais to Dover cost less than Simon’s current crossing?
b) What is the total price for of the cheapest journey to Dover to Calais and back again?
c) What is the difference in price between the most expensive time to travel from Dover to Calais, and the cheapest time to travel from Dover to Calais?
Suggestions:
This is a question created to test a student’s ability to read and interpret a line graph. The first question although straight forward, appeared recently in a Higher GCSE Maths paper and the wording confused many students. Students often take 3-4 minutes to answer this question, and marks will of course be awarded for workings and partial answers.
Teachers could extend the learning by considering:
- Simon says that the 8am crossing from Calais to Dover is 25% higher cost than the 11am crossing from Calais to dover. Is Simon correct?
- Simon has a ‘£15 off each way’ voucher from a website, but it is only valid on the 5pm crossings. Simon’s wife Mary says that if they travel at 3.30pm instead (both journeys) the cost works out cheaper than using the voucher. Is Mary correct?
