Difficulty: Rating: GCSE Marks: |
GCSE Text:
Whilst on a summer holiday in Spain, the temperature of the water & air was measured, and the results are shown in this bar chart:
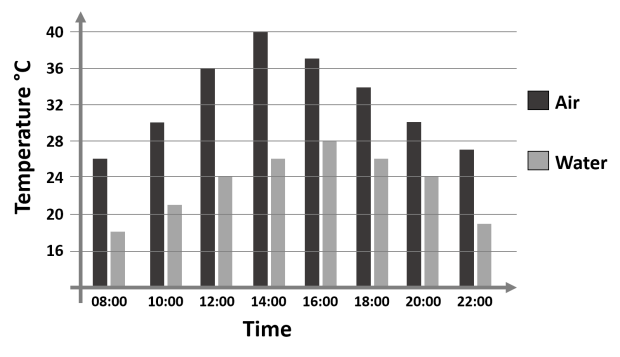
a) At what time was the water in the pool the warmest?
b) At what time was there the least difference between the air & water temperatures?
c) Estimate how warm the air was at 1:00pm
Suggestions:
A fun examples of a bar chart questions that could easily appear on a GCSE Foundation paper. Students are obviously encouraged to interpret the legend/key to decide which bar to measure, and need to read the questions carefully. Common mistakes are normally found on question b).
Extension Ideas:
Teachers could extend the learning by considering:
- When the pool heating is switched on, the water is often 5ºC less than the air temperature at midday. How much warmer would the water be at midday with the heater on, compared to the bar chart value above which is without the heater?
