| Difficulty: Rating: GCSE Marks:  |
GCSE Text:
Maria & Lance went on a journey to Wales to visit friends. Below is a distance time graph that shows their journey so far:
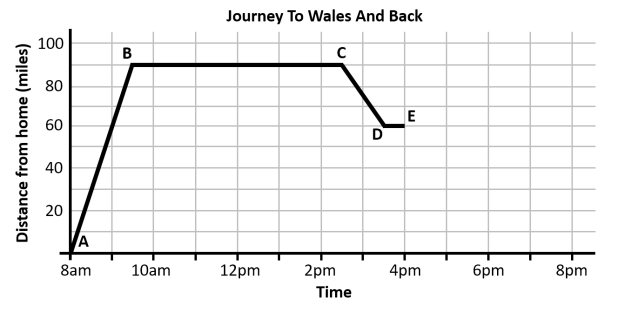
a) How much time was spent with their friends at their final destination?
b) What was their average speed on the journey from home down to Wales?
On the way home, they stopped off at some services as the traffic was slow.
c) After leaving the services, if they drive at an average speed of 40mph, what time can they expect to arrive back home?
Suggestions:
This is a common GCSE problem involving the interpretation of a distance time graph. Students will need to read the axis carefully to determine time and distance values, and they will need to remember and apply speed/distance/time formulae. It works well to ask students to identify what each stage of the graph represents, and letters have been added to help students describe the graph. It normally takes a class 3-4 minutes to solve this.
Extension Ideas:
Teachers could extend the learning by considering:
- An alternative route home was available which had no traffic, although it would have involved driving an extra 20 miles. If the average speed on that route would have been 50mph, would Maria & Lance have arrived home earlier if they had travelled this longer route without stopping?
