Difficulty: Rating: GCSE Marks:  |
GCSE Text:
At a holiday site, last years’ visitors were tracked and the results are displayed below in this table:
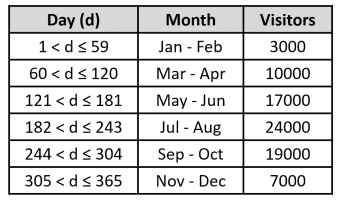
a) Use this data to draw a cumulative frequency graph
b) Estimate the number of visitors that had visited by the middle of May last year
c) During what month had 90% of last years’ total visitors already been?
d) The month of June is half way through the calendar year, but what percentage of visitors last year had been to the holiday site by the end of June, and why isn’t that 50%?
Suggestions:
The language used in cumulative frequency is tricky, and students often take a while to interpret the table provided. Students will initially need to select appropriate scales for the x and y axis, to ensure that the maximum figures can fit on. Students often discuss how to estimate where ‘mid-May’ is, and coupled with questions c and d, this question often requires confidence with percentages too. This video works best as a consolidation exercise, once CF principles are understood, and it takes around 10 mins to solve if the graph is drawn in its entirety.
Extension Ideas:
Teachers could extend the learning by considering:
- Which class/group contains the median number of visitors?
- What business decisions could be made as a result of analysing this CF graph?
- Create an accurate pie chart to supplement the CF graph as part of a Management analysis report on last year
